shinyRFate interface
Source: vignettes/interface_tutorial_0_presentation.Rmd
interface_tutorial_0_presentation.RmdRFate workflow, presented on Home page, is quite long and complex. Although
it can be divided into 4 main parts, each of them
requires several steps, and the user can quickly get lost or confused in
the whole process.
The organization of the Reference page, as well as the order of the tutorials, try to reflect these different parts.
A shiny interface, that can
be launched with the RFATE()
function from the RFate package allows the user to go
through the different steps without going through the code. Links to the
functions documentation, vizualization tools, the
possibility to start from pre-existing folders, always being
able to follow the progress in the console of the different
functions… This interface should make it easier to take control of
FATE with R.
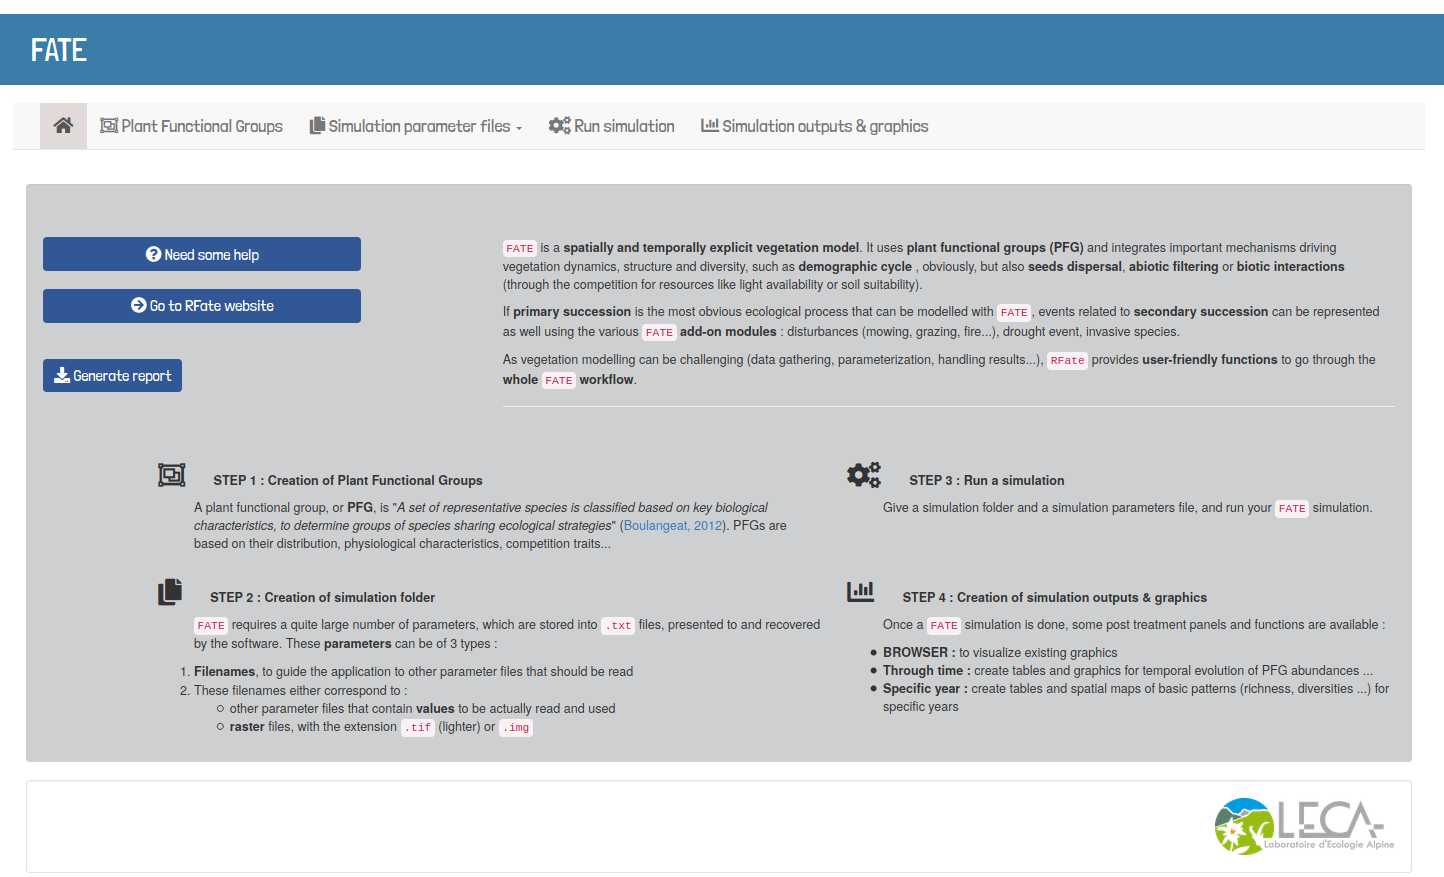
shinyRFate tool box
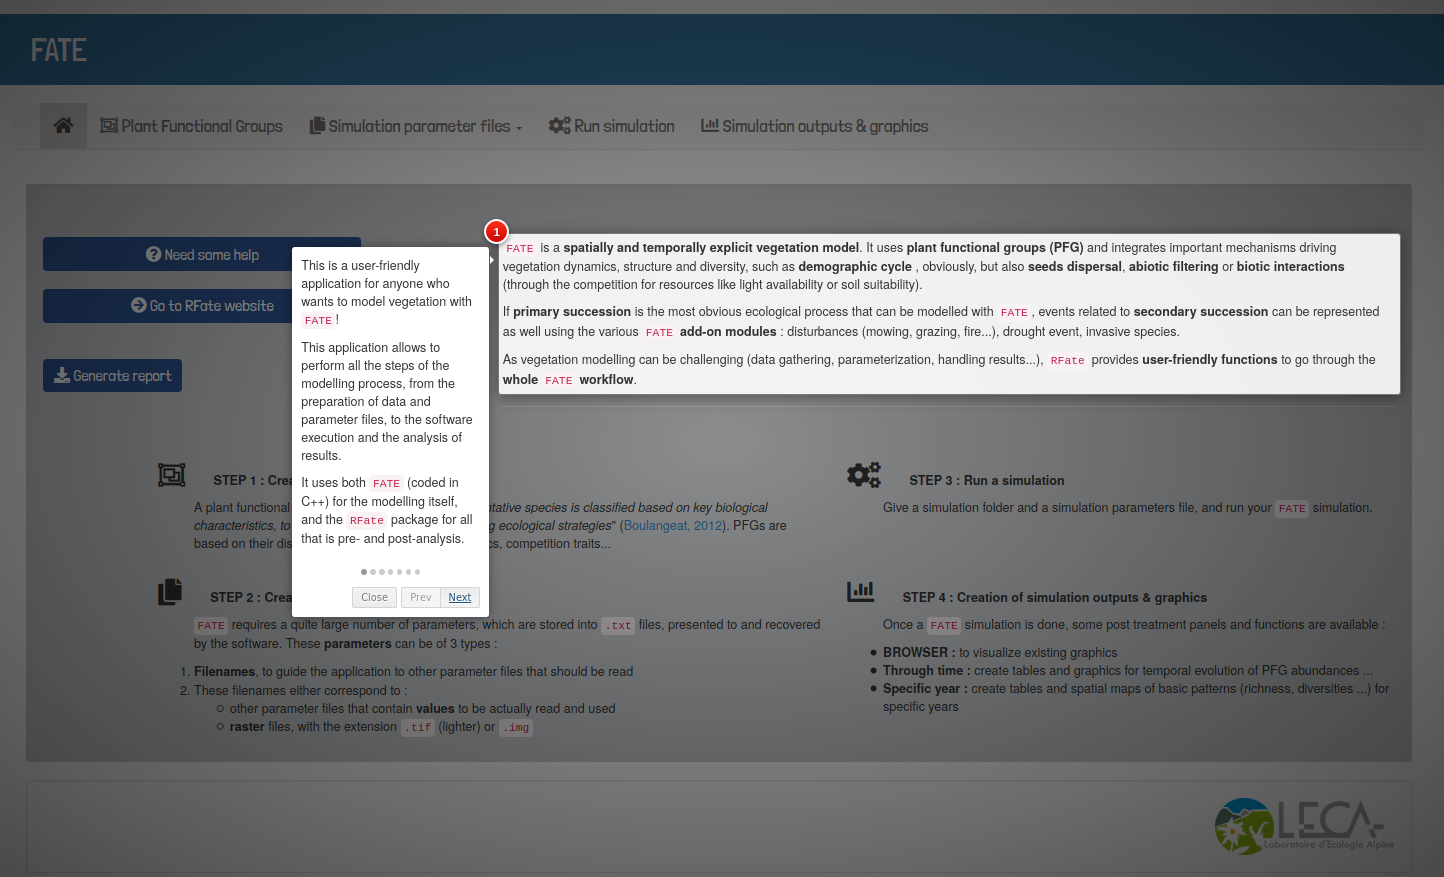
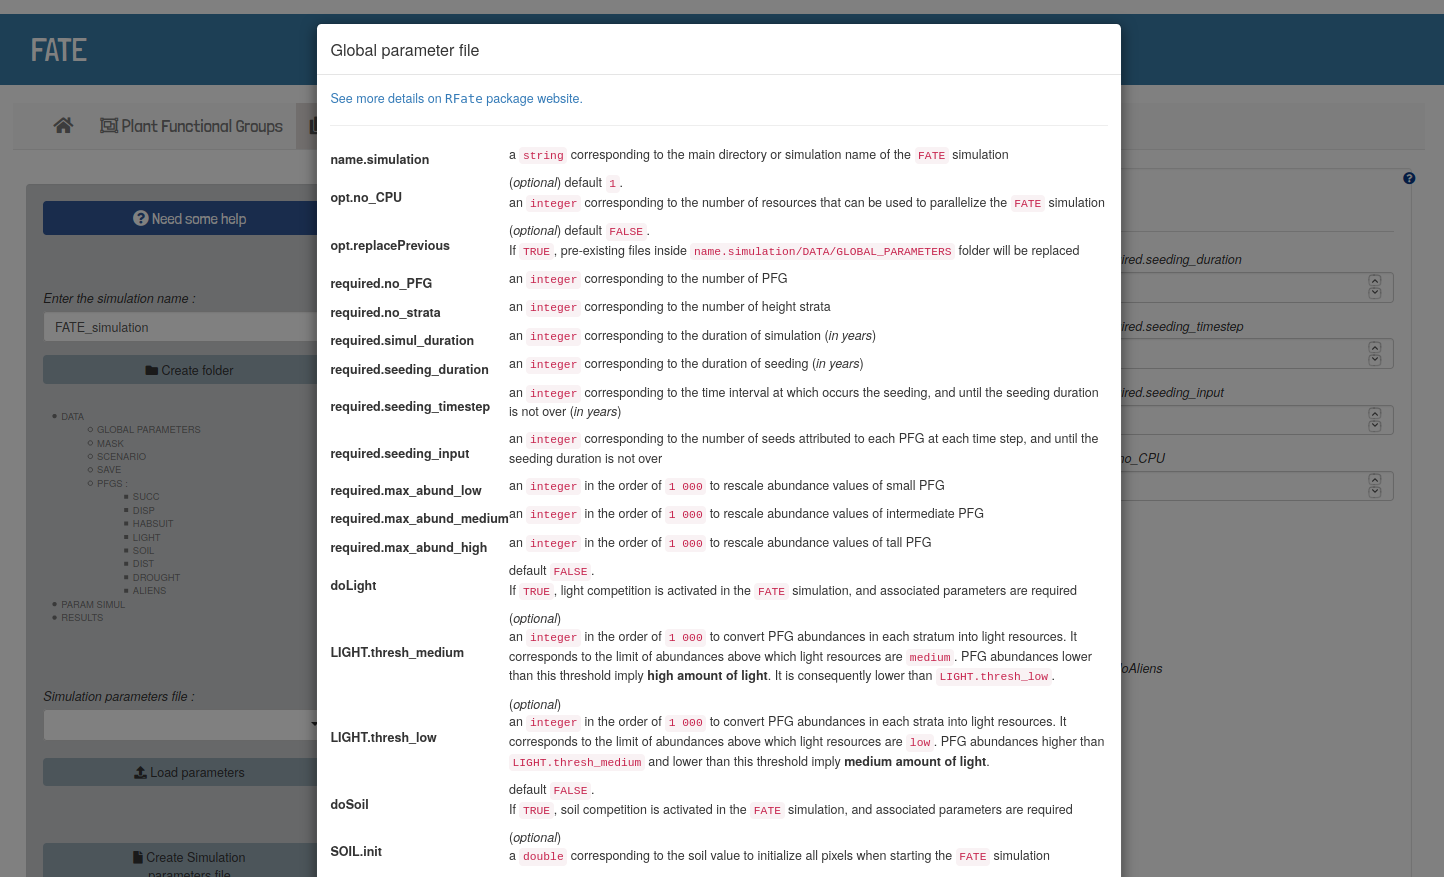
Help and documentation
Two types of documentation can be accessed all over the application through buttons. They give informations about :
- the different steps to be followed in each part
(global informations that can be found in the tutorials, about the differentFATEmodules for example)
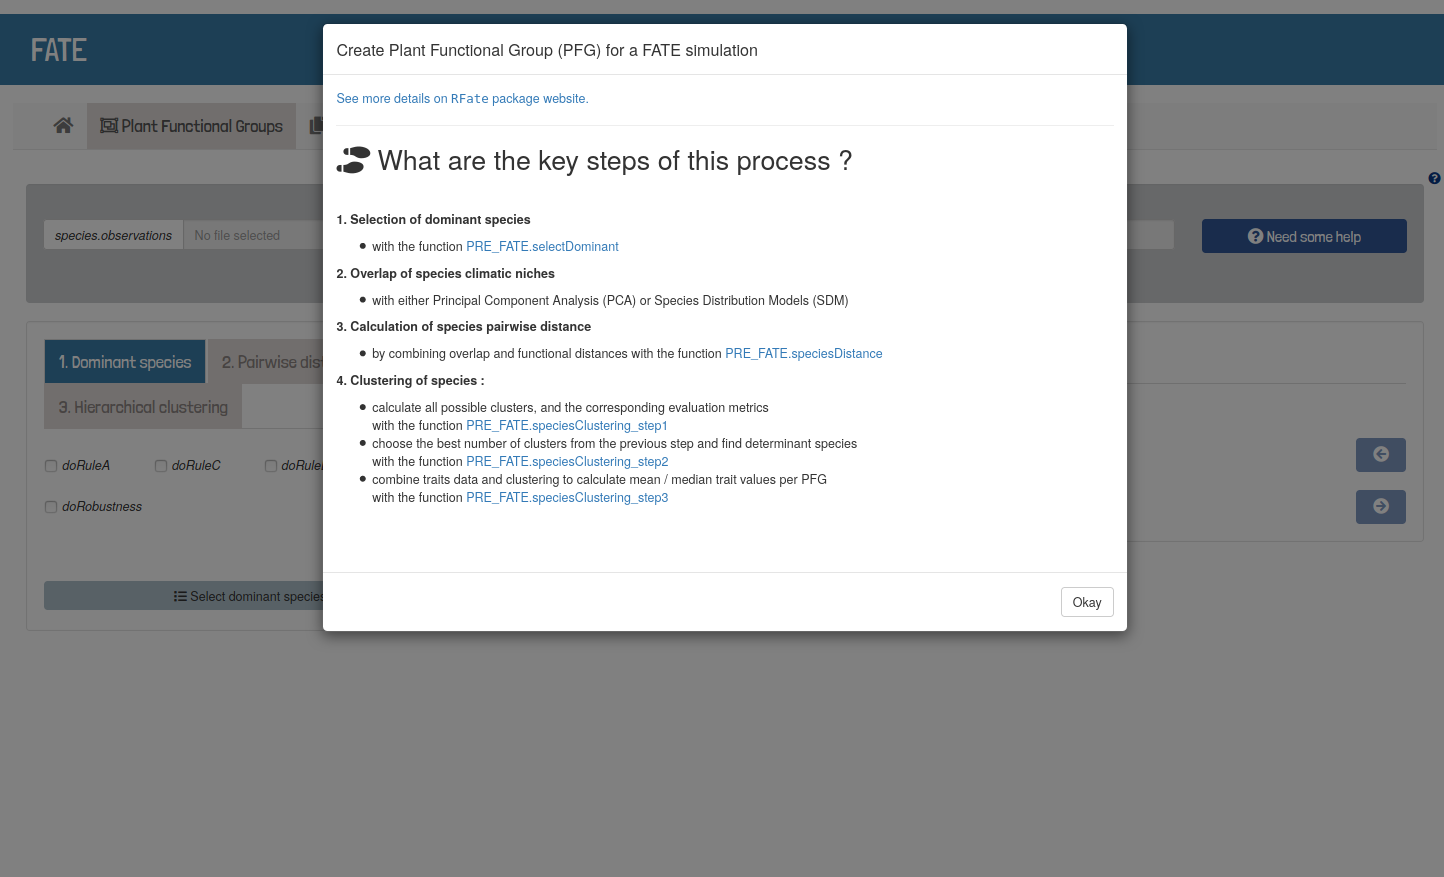
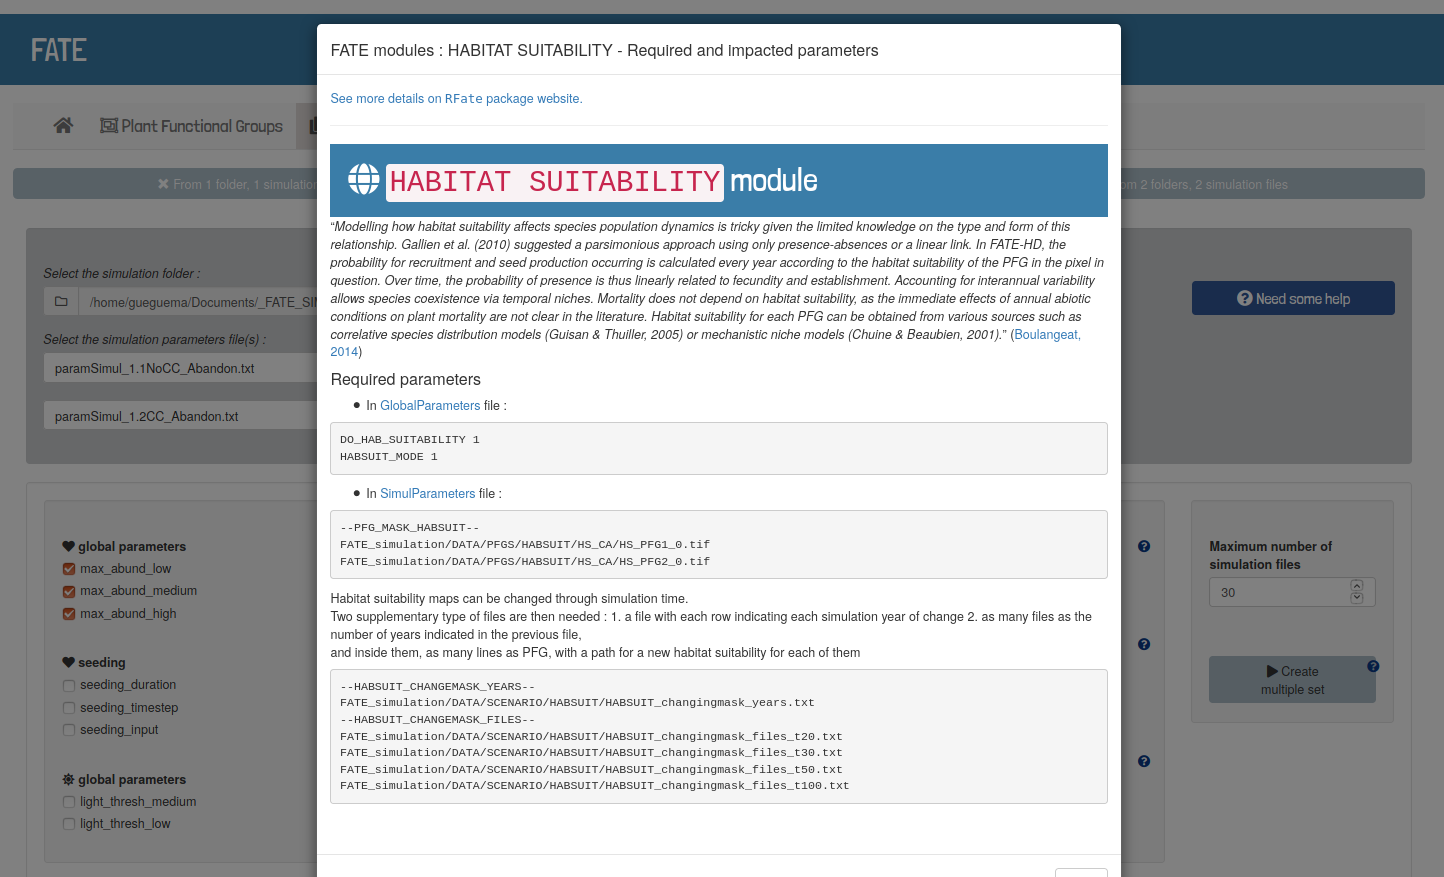
- the different parameters needed by the available functions, and redirection to more complete documentation (see Reference page)
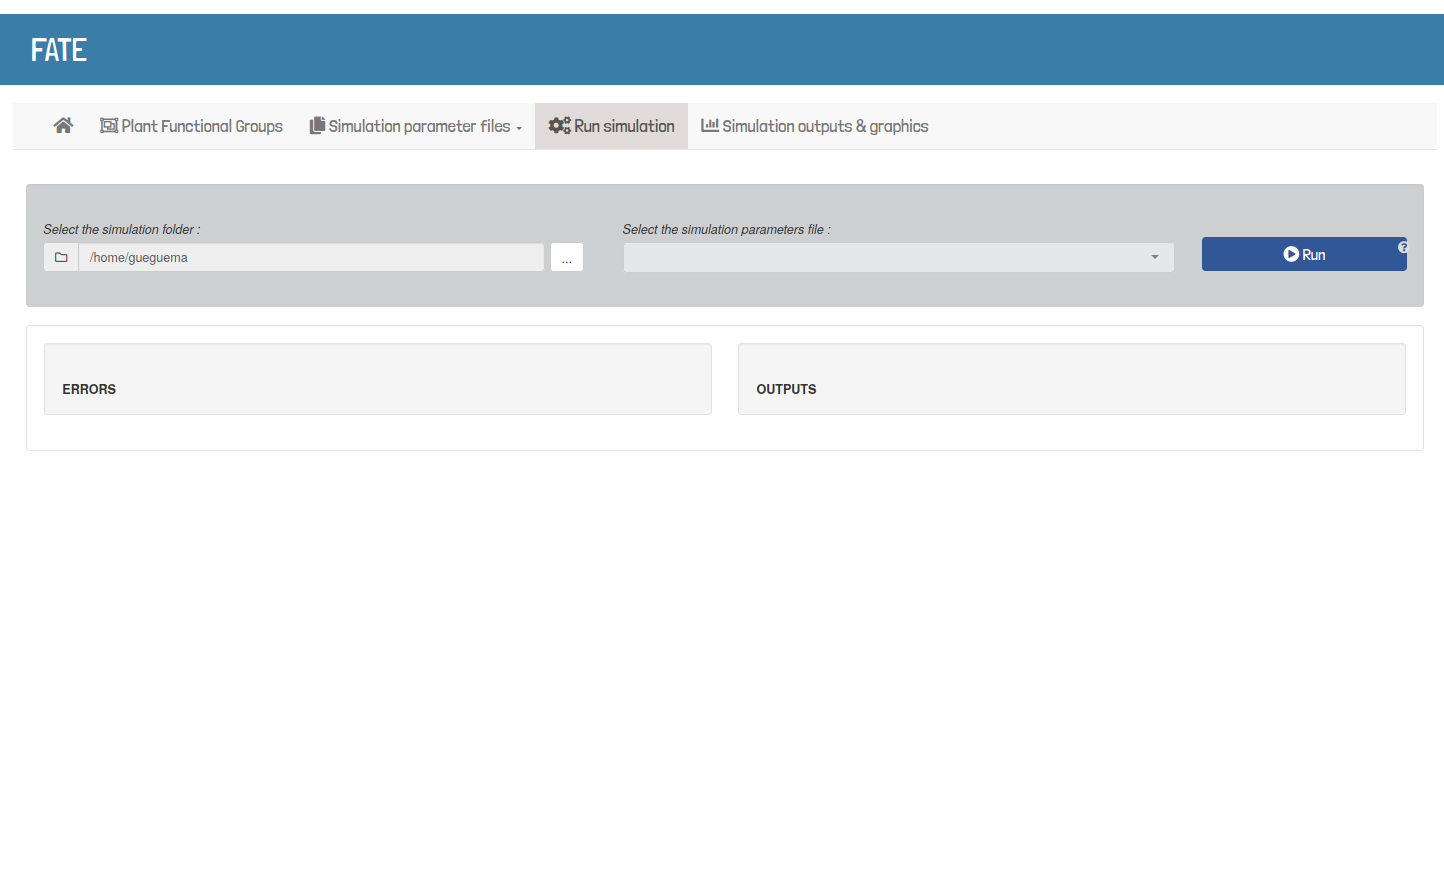
Monitoring of functions
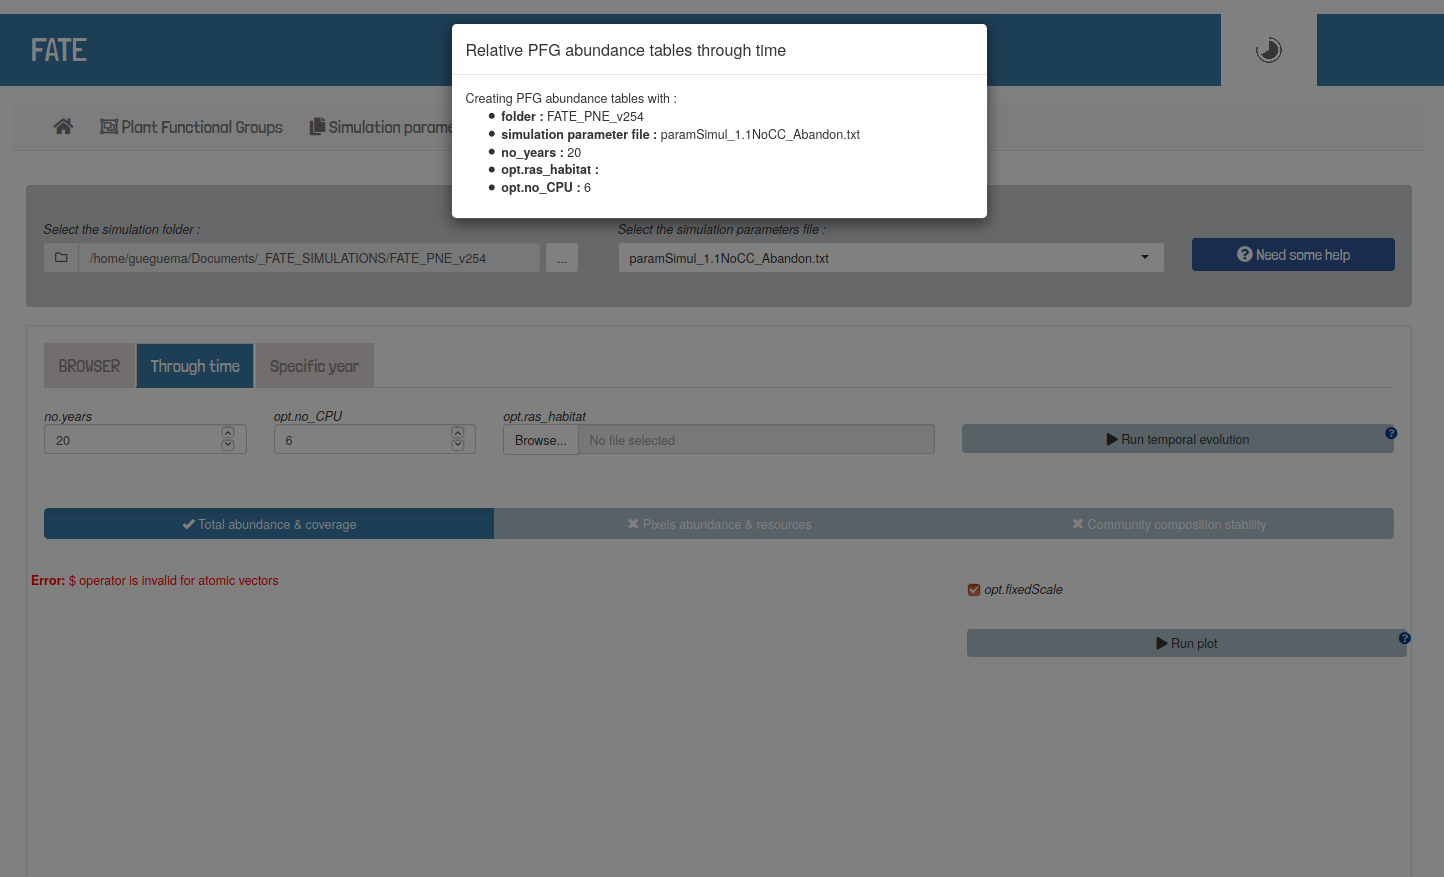
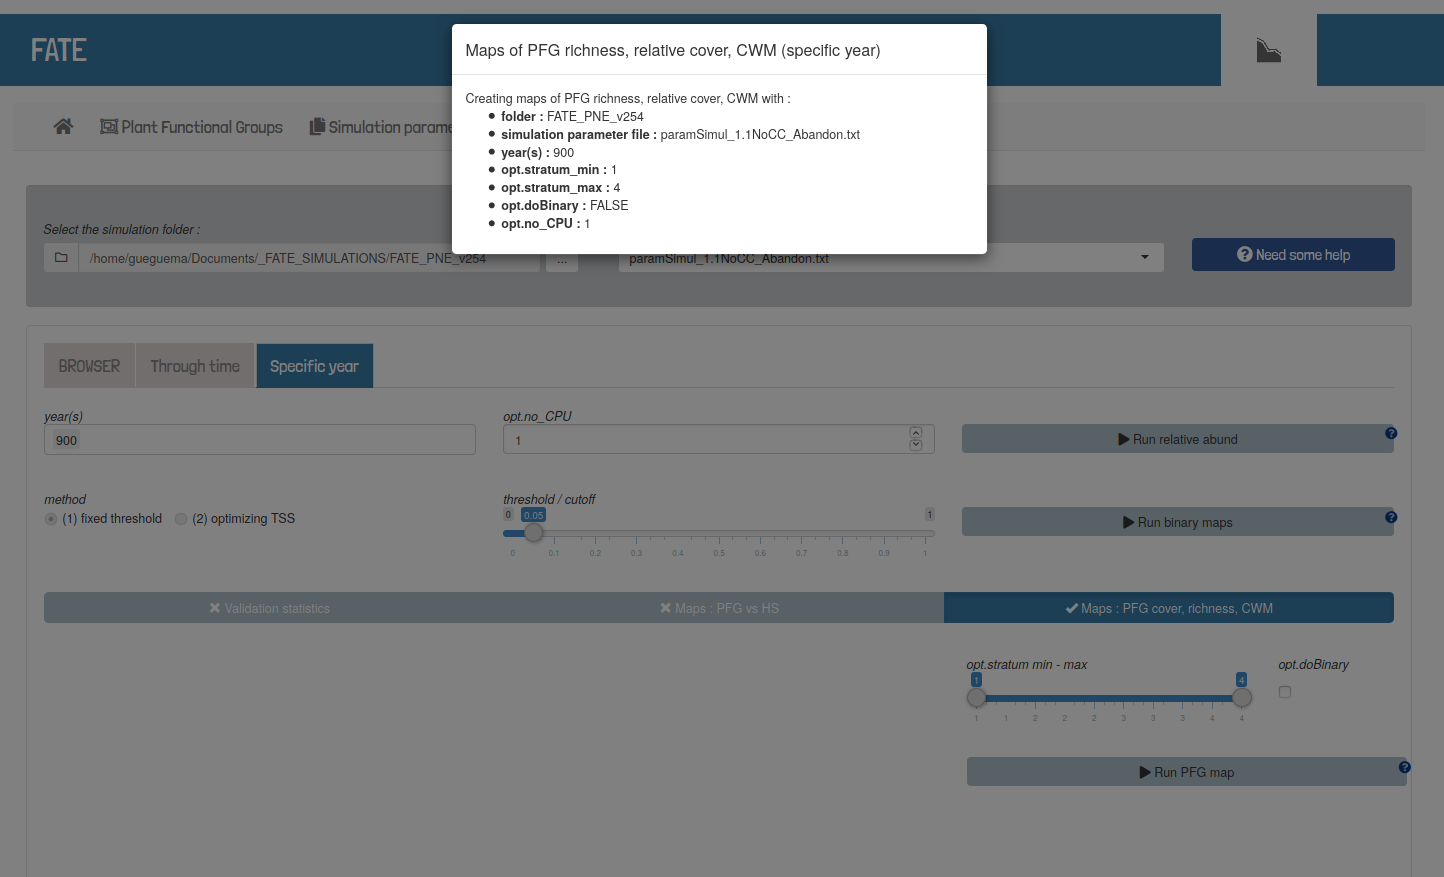
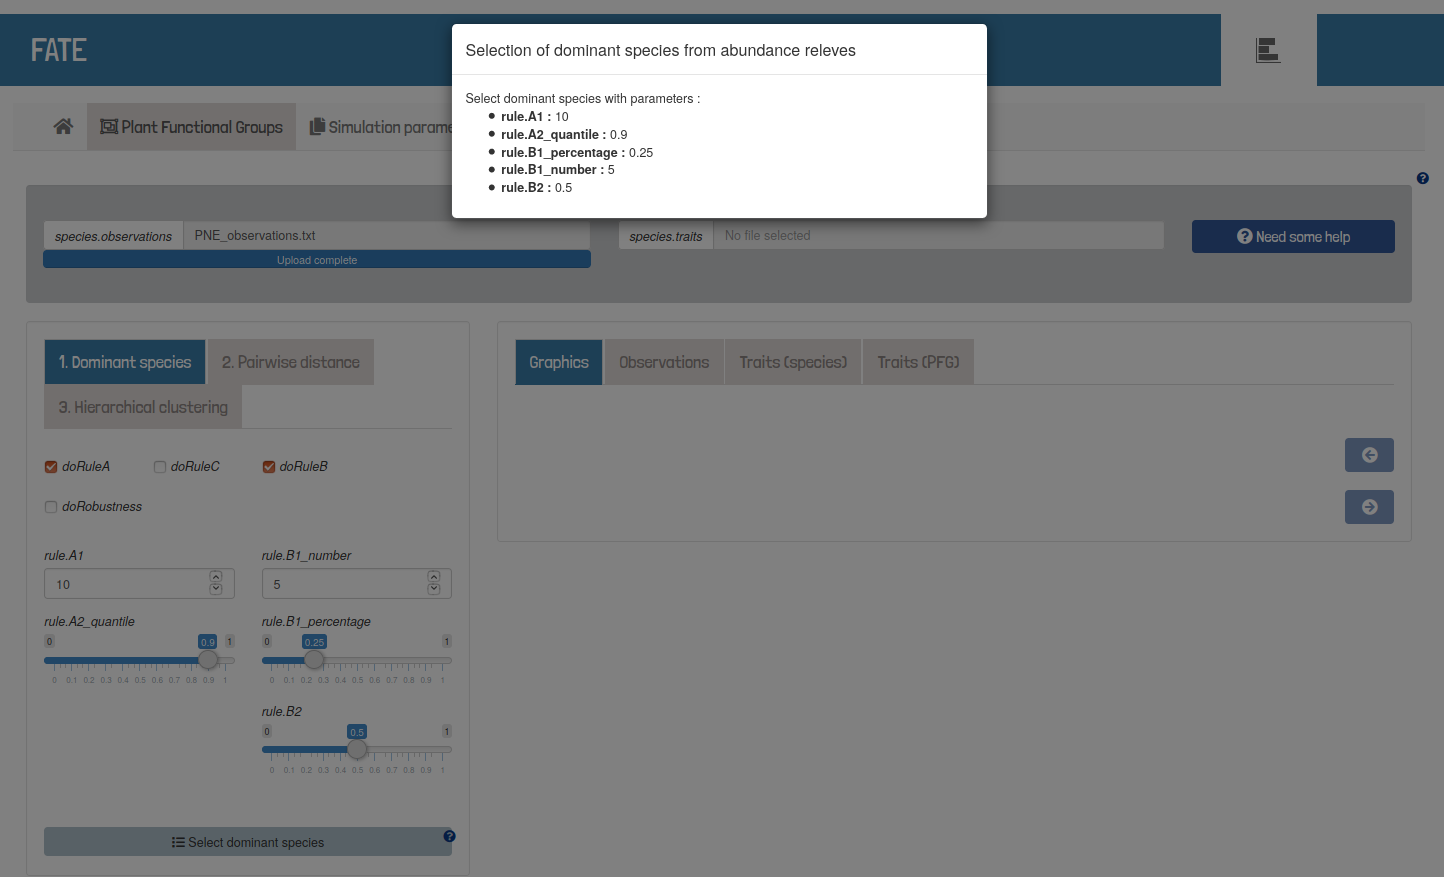
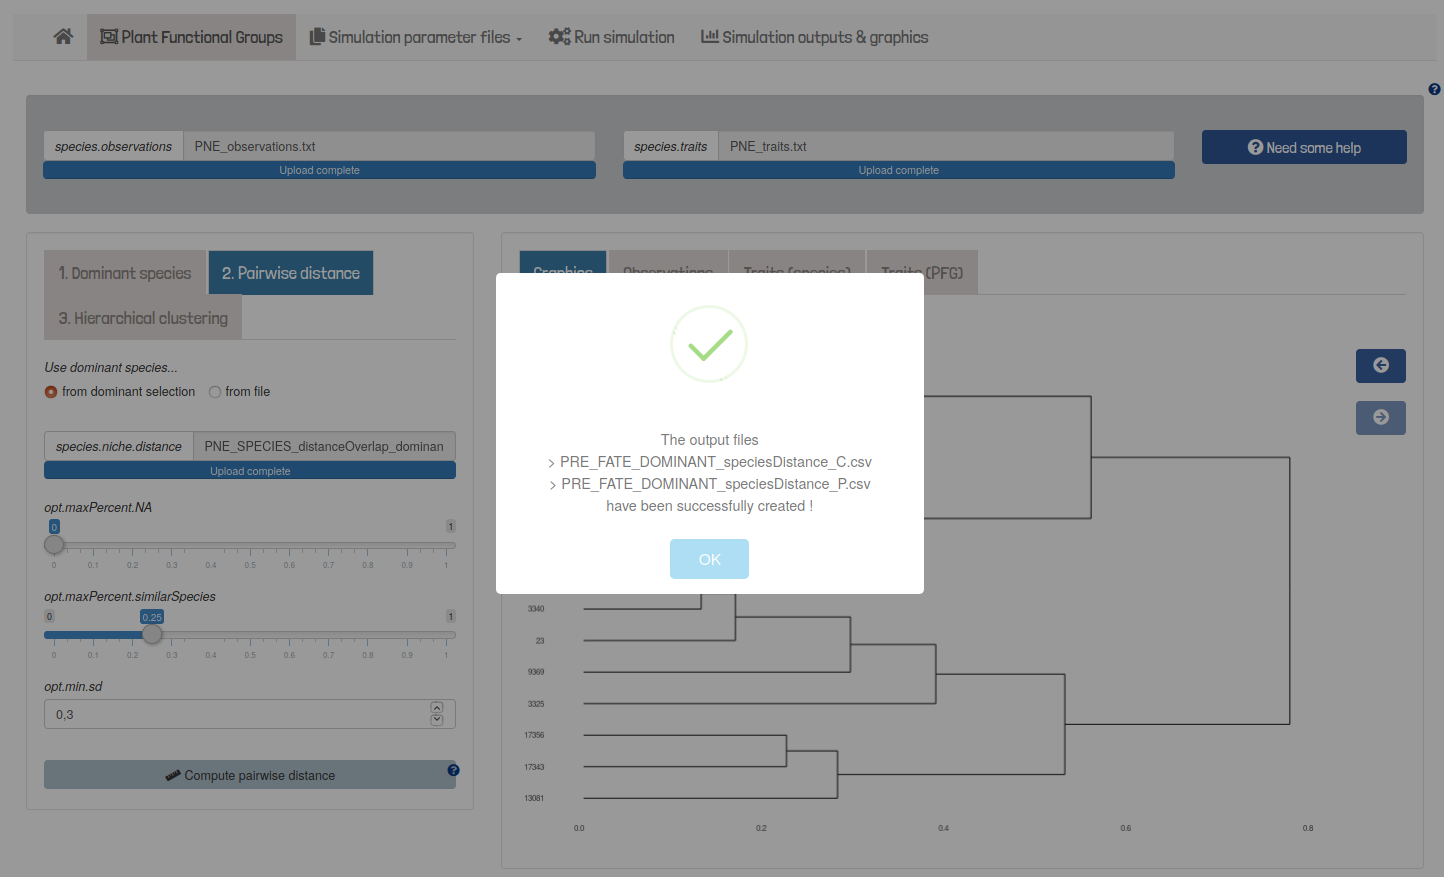
Once a button was pressed to start a function, a panel is displayed
as long as the function is running, indicating the selected parameters.
All informations printed by the function can be followed within the
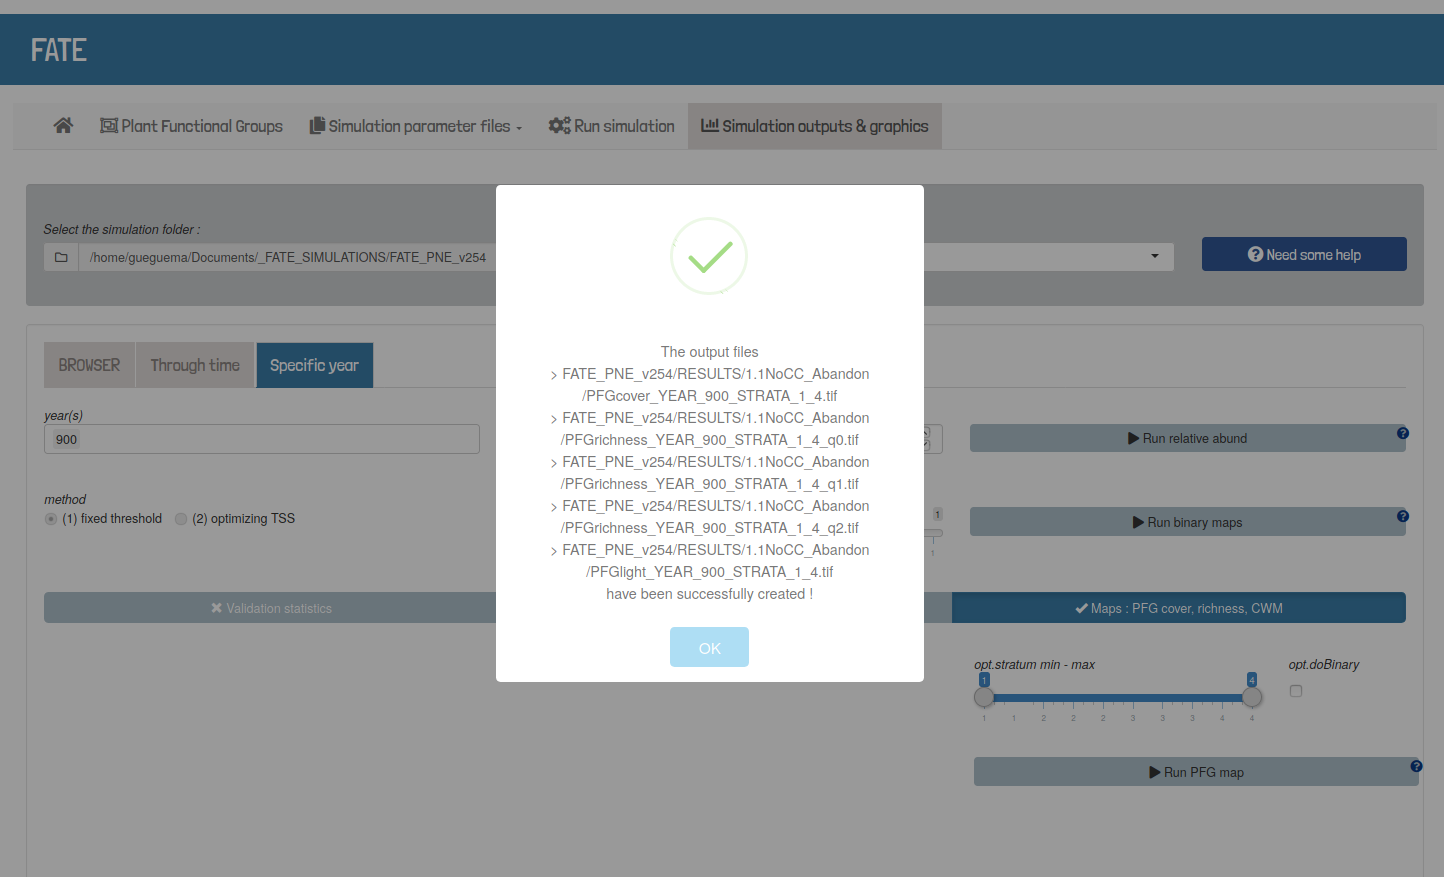
R console. Information panels appear when the functions has
finished running, results files have been created, or an error has been
found.
shinyRFate
workflow
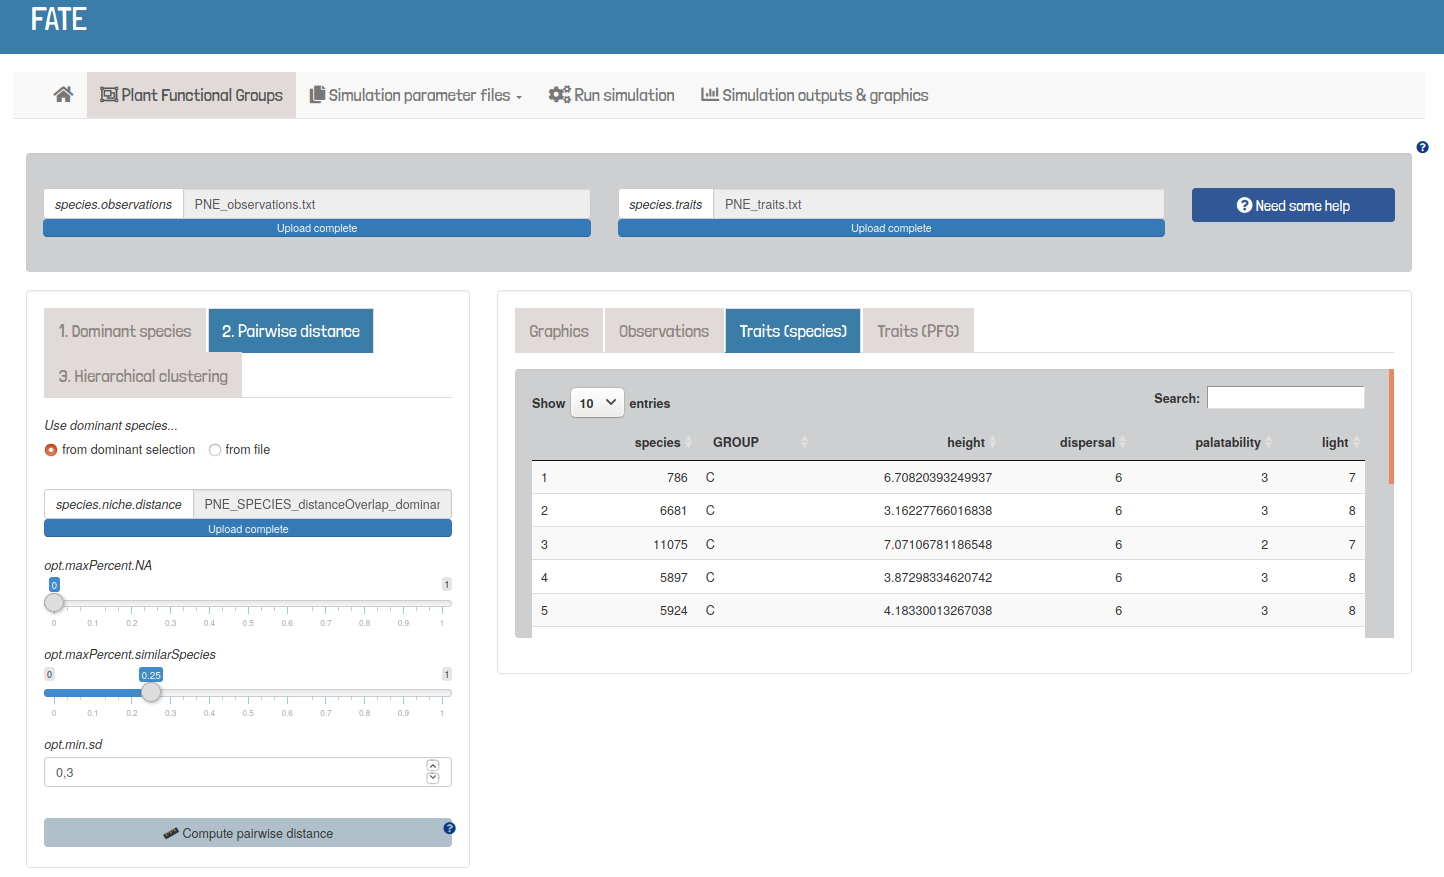
Plant Functional Groups
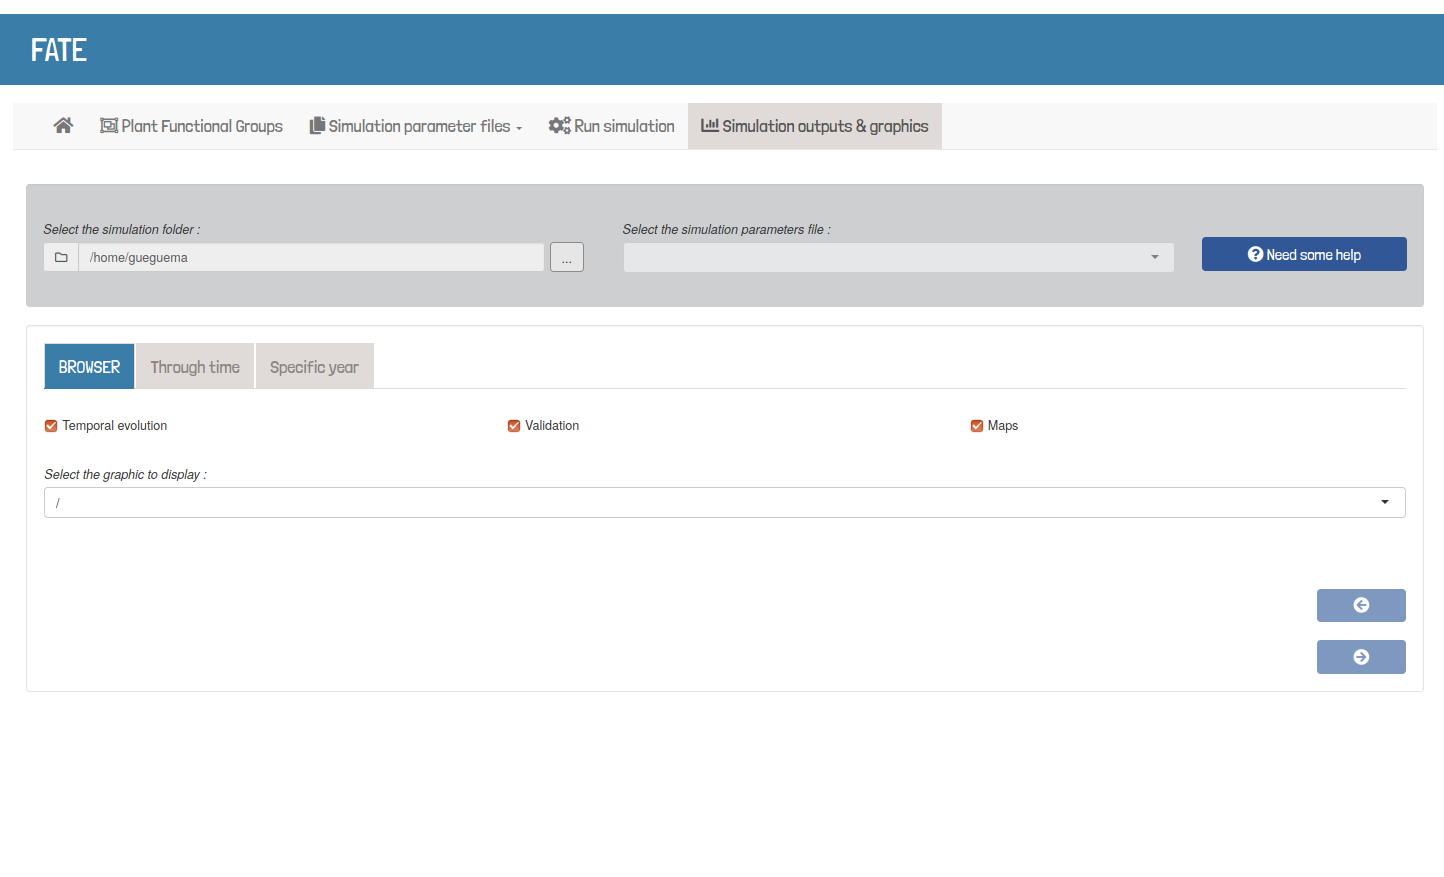
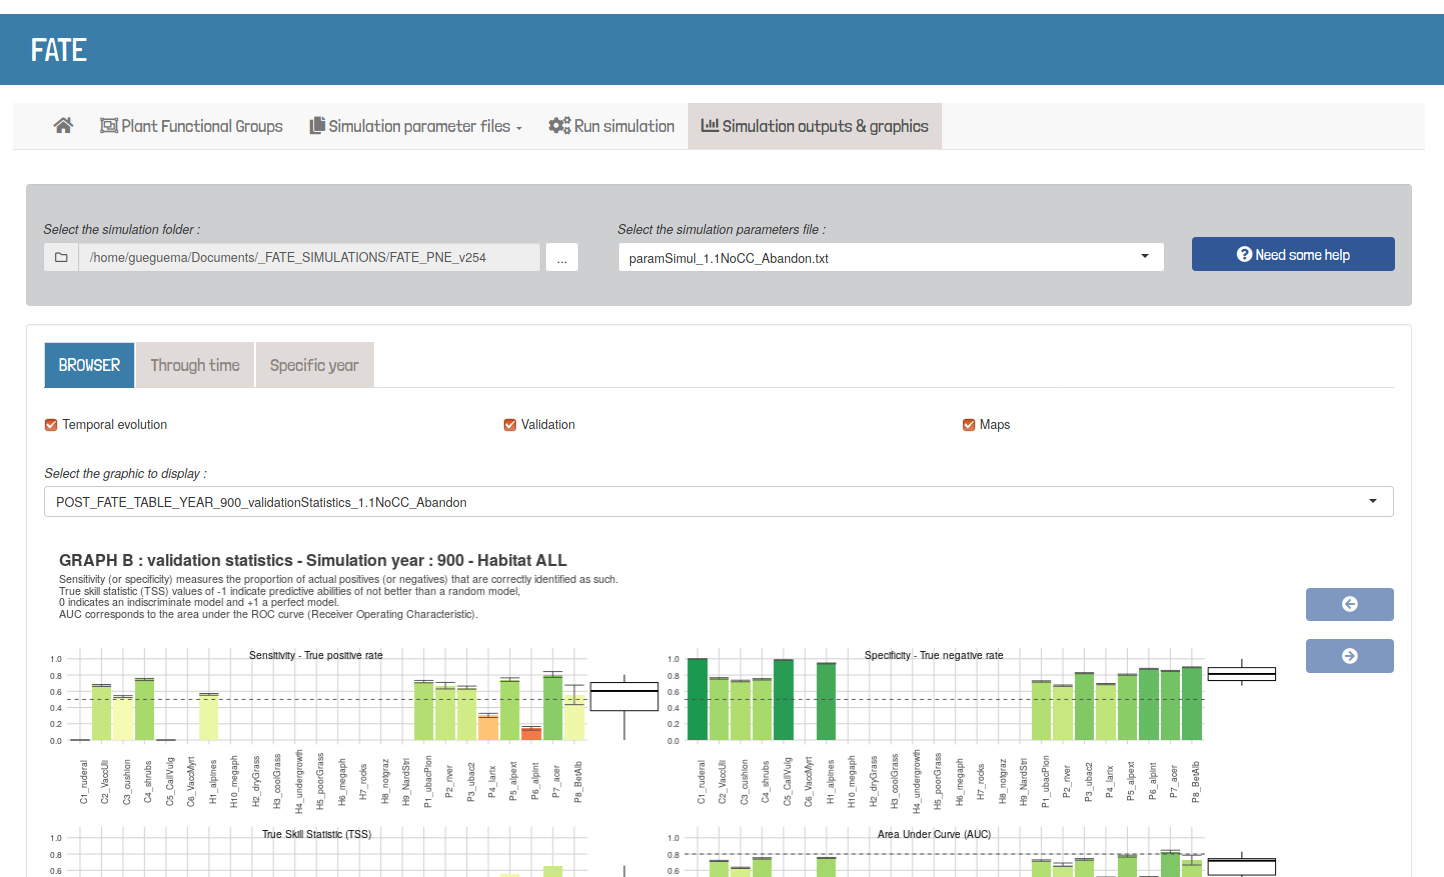
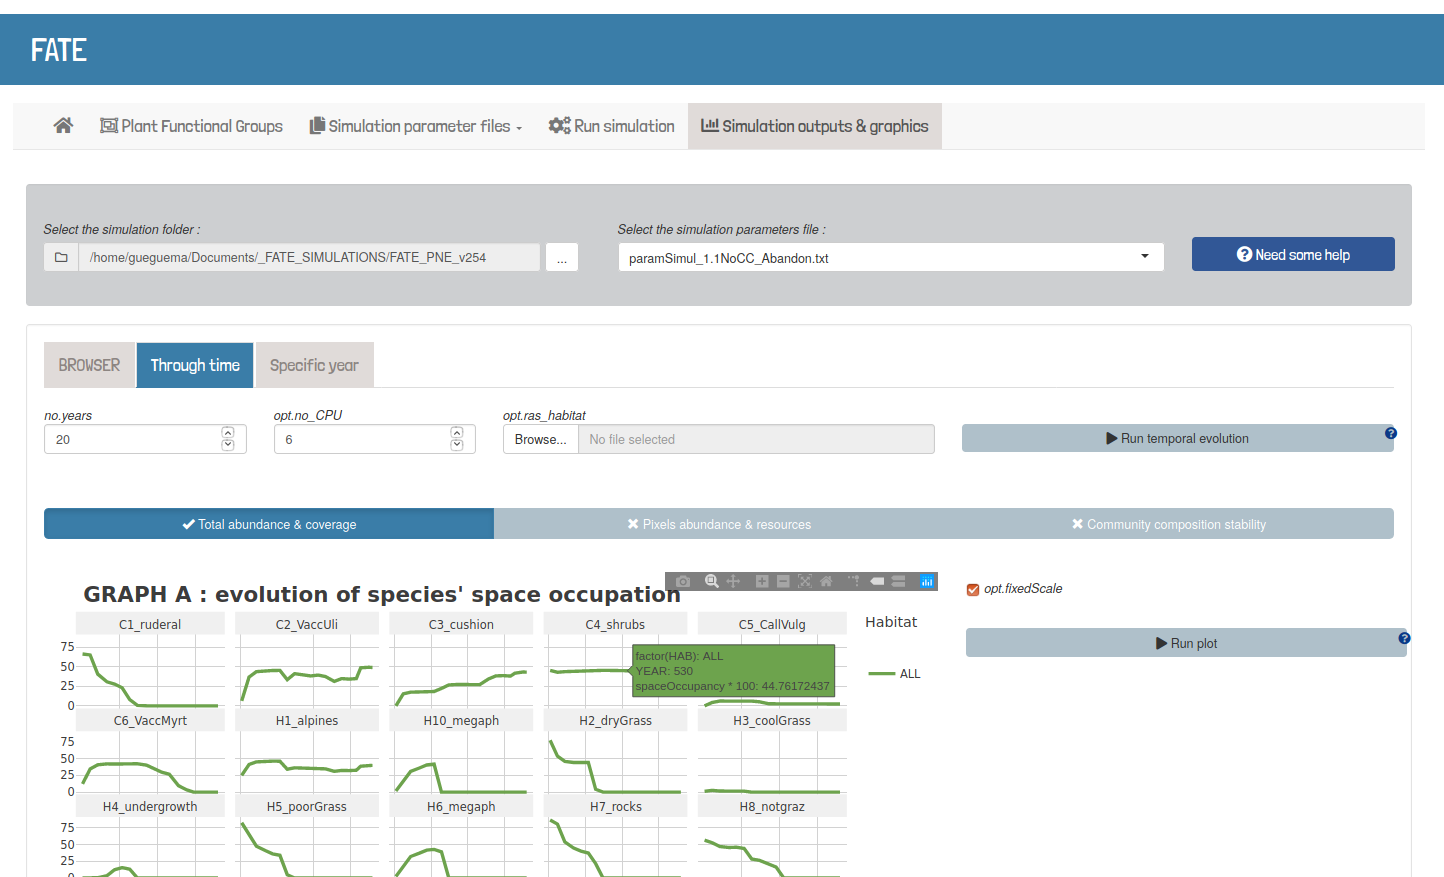
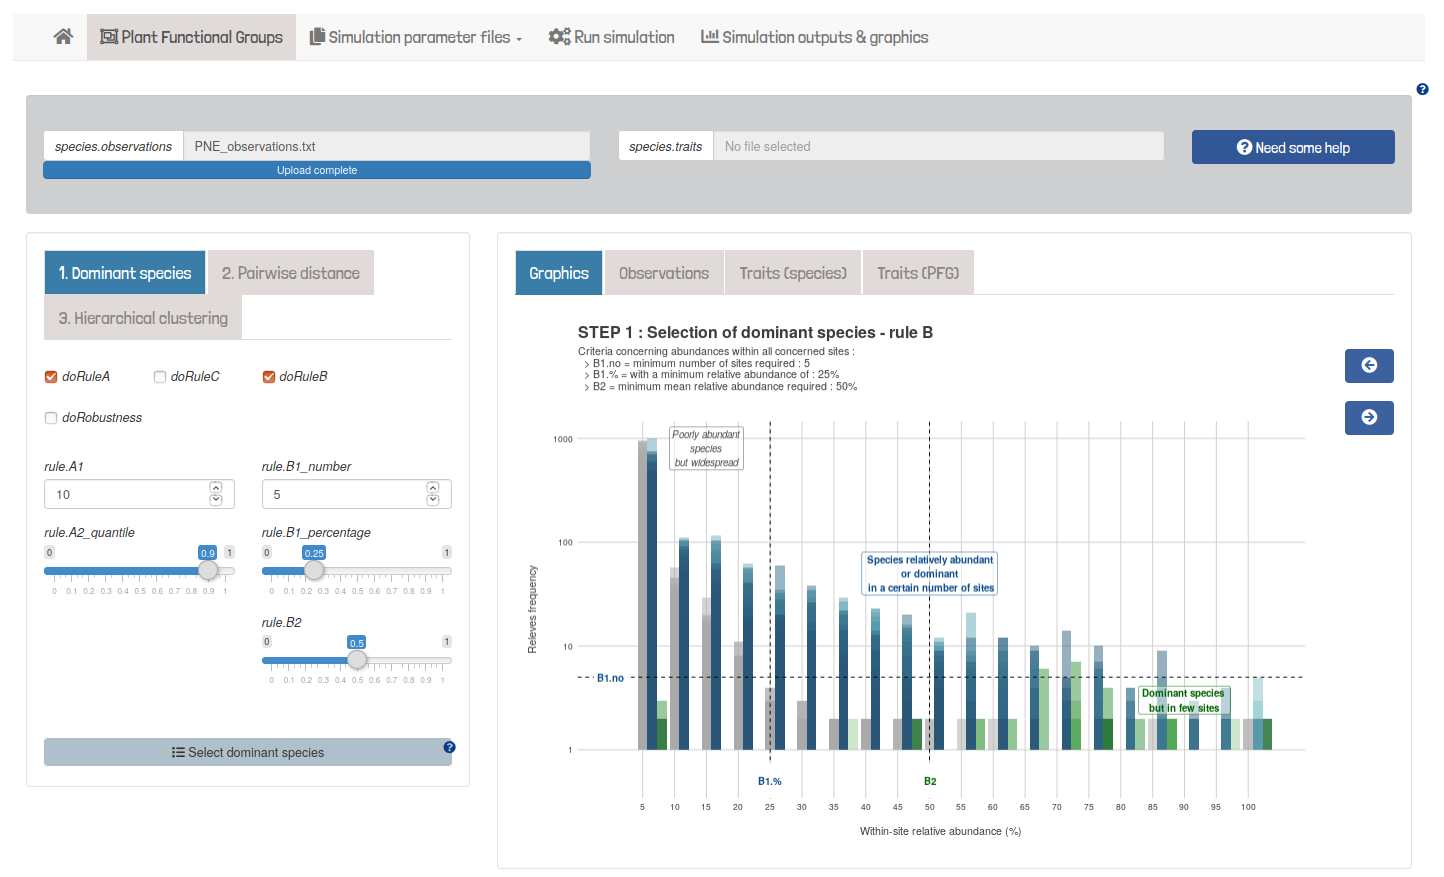
Created graphics and tables of loaded and used values can be
visualized through the application.
Generally, the data shown onto the shiny application is saved into
.csv or .pdf files.
Simulation parameter files
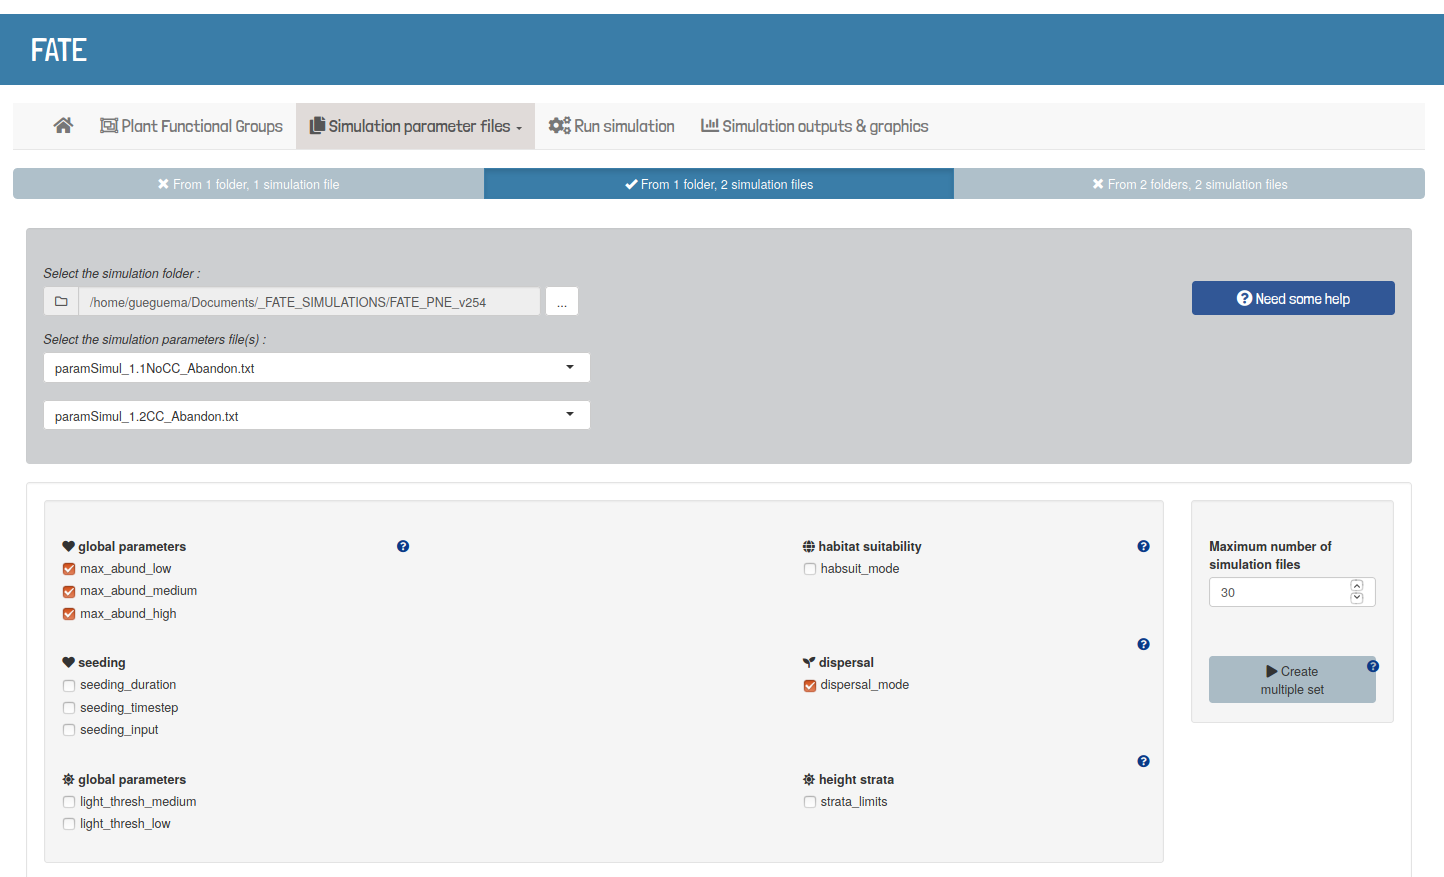
Parameter files and folders can be created, visualized and modified
from the application.
Multiple sets of parameters can be produced from a pre-existing
simulation folder.
